Console API

Unskippable part of debugging is of course Console API, but the thing is, have you ever checked all possibilities of it? You probably used console.log but there is much more to it that can be helpful in some specific situations where console.log is not enough to solve your problem or find what is causing that one horrible bug.
The Console API was differently defined for different browsers, and we all want to have some standardisation so here comes the whatwg community(https://console.spec.whatwg.org/). Even though we now have some rules and standardisation, still some browsers have their own implementations of this API for example Google Chrome DevTools implementation.
So let's get into all console API possibilities:
We can start with the Console.table: Let's say you have a lot of nested objects that you want to display in a human readable manner, you will need to use a table
Table takes two arguments:
- data: a collection of data
- properties: an array of objects of the fields you want to use to display the table.
So for example, if have some array with data:
const data = [
  { id: '01', userId: '001', Name: 'first user' },
  { id: '02', userId: '002', name: 'second user' }
]
So when we run console.table(data) we will get table as you can see below

You can also paste code section above and run it in the chrome devtools section to see for yourself.
Console.assert
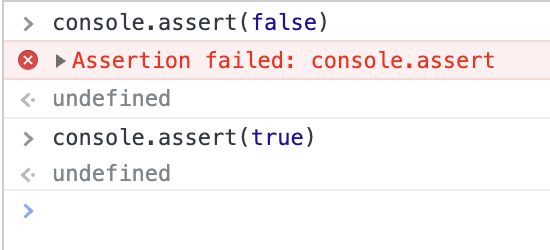
The console.assert is a function that is used to see if the value we are observing is truthy or falsy value. So if the expression is falsy there will be a message displayed, but if it is truthy nothing will be displayed.
Console.count()
Show number of times when specific value was called, so basically it is a counter that increases each time the same label is called.
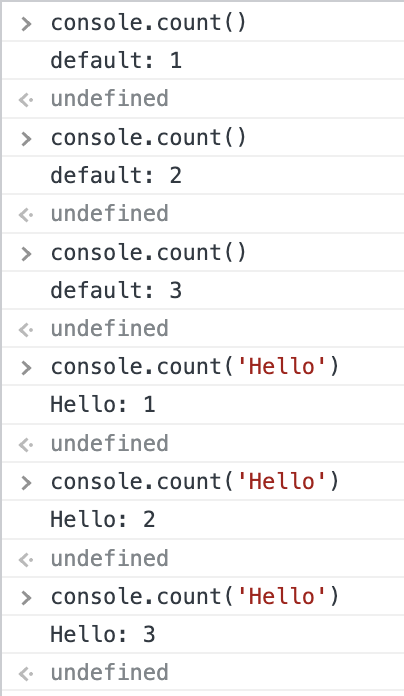
With console.countReset we can reset the counter.
Console.group && Console.groupEnd
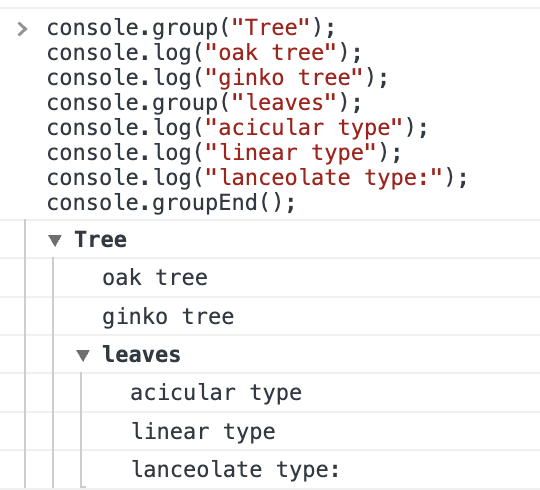
In the case of a big number of logs that we want to see, the best choice can be using console.group because this way we can categorise logs by groups and make it more readable.
Console.groupEnd() as the name says it, it is used to close created groups.
Lets look at this example:
console.group('Tree')
console.log('oak tree')
console.log('ginko tree')
console.group('leaves')
console.log('acicular type')
console.log('linear type')
console.log('lanceolate type:')
console.groupEnd()
Or if you type it and run it
Console.dir()
Beside console.log() console.dir function can be the most useful. There is not much difference between console.log and console.dir in newer JavaScript engines but there is a difference when you are using it in Node.js. This function takes two arguments and one argument is optional.
console.dir(obj[, options]) :
- obj - required
- options - optional usage:
- showHidden <boolean>. If true then the object's non-enumerable and symbol properties will be shown too. Default: false.
- depth <number> Tells util.inspect() how many times to recurse while formatting the object. This is useful for inspecting large complicated objects. To make it recurse indefinitely, pass null. Default: 2.
- colors <boolean>. If true, then the output will be styled with ANSI color codes. Colors are customizable. Default: false.
So why would you console.dir use it
In my case I used console.dir instead of classic console.log() because i couldn't get to the nested child objects of response data from the specific API that I was working with, so with
console.log(wanted object, {depth:null})
I got all that I needed, another important tip if you are working with VS code you have to adjust the terminal to show a greater number of lines, you can change that in VS code Settings in the section Terminal › Integrated: Scrollback
and here you can change how many lines you want to see in the terminal, and because of using console.dir feel free to add a large number of lines.
Console.profile() & console.profileEnd
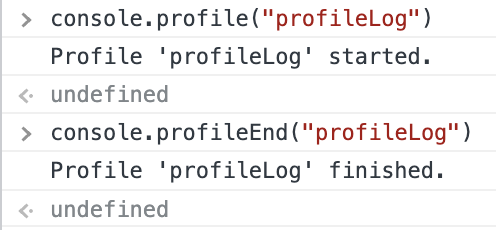
These methods allow us to measure the performance of a specific block of code and identify any performance bottlenecks. When we call console.profile(), it starts recording performance information about CPU and memory usage where it is called. With console.profileEnd() we stop recording.
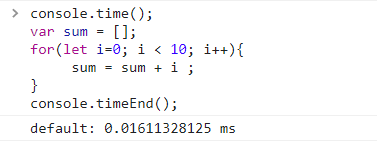
Console.time() & Console.timeEnd()
console.time() starts a timer with a specified label. This timer can be used to measure the time taken for a specific block of code to execute. It is commonly used for performance optimization and debugging.
For example:
console.time()
var sum = []
for (let i = 0; i < 10; i++) {
  sum = sum + i
}
console.timeEnd()
In conclusion, the JavaScript console API provides a wide range of powerful tools for debugging and development besides console.log() It can help you to identify and resolve issues in your code, and to improve the performance and quality of your applications.